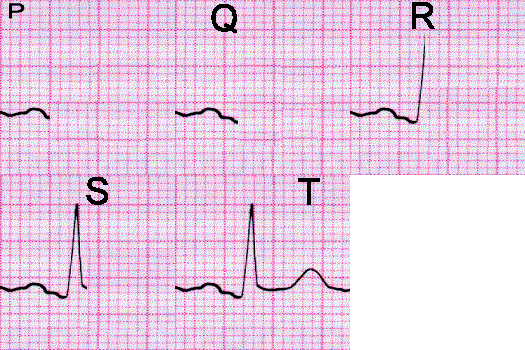
- The P wave represents atrial depolarisation- there is little muscle in the atrium so the deflection is small.
- The Q wave represents depolarisation at the bundle of His; again, this is small as there is little muscle there.
- The R wave represents the main spread of depolarisation, from the inside out, through the base of the ventricles. This involves large ammounts of muscle so the deflection is large.
- The S wave shows the subsequent depolarisation of the rest of the ventricles upwards from the base of the ventricles.
- The T wave represents repolarisation of the myocardium after systole is complete. This is a relatively slow process- hence the smooth curved deflection.


