ISL2000: The Biology Project
Denice Warren
www.biology.arizona.edu
About The Biology Project
| Founded: | 1996 with a 2-year grant from the Hewlett Foundation |
| Current Funding: | NLE grants, Depts. of Biochemistry and MCB, NSF Recognition Award, HHMI... |
| Team members: | - 2 web developers - 1 student graphic designer - 1 server administrator/database programmer - Several faculty content experts - 2 volunteer translators (in Argentina & Chile) - Collaborators at SWEHSC - Departmental computer support people |
| About the site: | - content mirrors Biology 181 + other biology - site is modular and scalable - format is generalizable - contains nearly 5,000 web pages - almost 40 separate modules |
| Site statistics: | >100,000 user sessions/month average user stays > 10 minutes > 2.5 million server hits/month most traffic from outside UA |
| Awards: |      |
| Publications: | NetWatch Hotpick, Science Magazine, March 1999. Biology Pick Yahoo! Internet Life Magazine, September 1998 |
Why publish learning materials on the web?
- Cheap color publishing
- Unlimited distribution
- Animations & audio
- Easy access to external resources
- Interactivity
| What is interactivity? |
Building in interactivity, inquiry & problem-solving
Spectrum of Interactivity
- Shovelware
- Online brochures, syllabi, manuals, slide presentations, etc.
- On-line references/teaching materials
- Studying Cells Tutorial
- Problem-solving
- Monohybrid Cross Problem Set
- Simulations
- Karyotyping Simulation
- Environmental Tobacco Smoke and Lung Development
- Inquiry-based learning
- Driftworms
- Helper applications (Molecular Visualization)
- Group Projects
- Student Biology Web (Honors Bio 181)
A la Carte Menu of web-technologies
| Technologies have trade-offs. Evaluate new technologies carefully. |
- Plain old HTML (like this page). Be aware of browser issues.
- Behind-the-scenes-humans
- Database integration
- Javascript
- Animations & Sound
- Java
- Shockwave
- Web-based conferencing
- Helper applications
- Real Audio/Video
Be old-fashioned! Use the simplest possible technology to achieve learning objectives.
Practical issues of web design & usability
- Storyboarding & development strategy
- Good web design begins on paper.
- Planning pays off in the end! Don't rush things.
- Don't let the technology get in the way of student learning.
- Become an expert in usability. (www.useit.com)
- Make your pages accessible to those with disabilities.
- Be realistic about your audience.
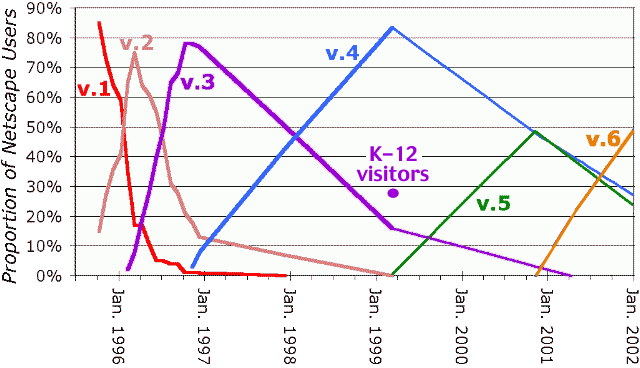
Use of various versions of Netscape from late 1995 to January 2002
