
 PredatorPrey
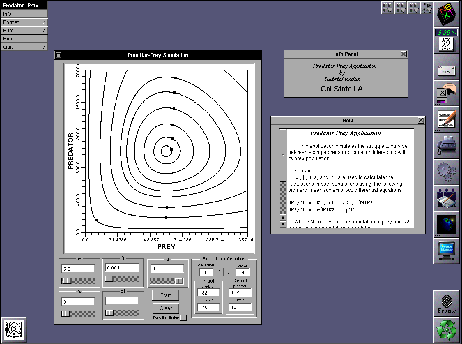
PredatorPrey was created for college courses in introductory biology and ecology. It graphically illustrates the dynamics of the Lotka-Volterra mathematical model of a predator and its prey. The two axes represent the population densities of each species. Clicking the mouse anywhere in the graph defines a pair of initial densities for a simulation of predation. The trajectory which flows from the initial condition is the solution to the Lotka-Volterra model. Up to fifty simulations can be executed simultaneously. Students explore the predicted behavior of the model by choosing different sets of parameter values and initial conditions. The equilibrium can be plotted on the graph. This application demonstrates the ecological concepts of neutral predator-prey cycles, damped oscillations, species coexistence, and stability. A screen image of a typical PredatorPrey session appears below. PredatorPrey was written by Mr. Gabriel Rodas, a computer science student at Cal State LA.

Click to download full resolution image (61.9 KB.)
 Return to the Application Catalog